Primary Care Practices and Coronavirus - Some Observations from Systems Thinking
- Category: Transformation Blog
- Published: Friday, February 28 2020 14:08
- Written by Super User
- Hits: 13029
Primary Care Practices and Coronavirus - Some Observations from Systems Thinking

Photo by engin akyurt on Unsplash
If you're anything like me, you're starting to get worried.
This latest Coronavirus emanating from China has me spooked. The infection spread, and specifically the speed of it is unusually voracious, and cases have been confirmed pretty much all over the planet. Now it's not all gloom and doom - the severity of the symptoms don't appear to be that bad in normally healthy adults at least, but like any flu - like virus, there are a percentage of the population who lack the immune system fortitude to effectively deal with it. The stock market is in free fall, supposedly based on worries of the potential effects on the worldwide economy, and generally we're starting to see the signs of heightened anxiety in the general population, especially in larger cities, airports and other areas where large quantities of people gather. In such times, large numbers of previously rational people start behaving anxiously, especially when concerned about their own health.
Change scene for a second to your average Primary Care Practice. They've seen things like this before. They're generally aware of the current best practices of care, and know the medical steps they need to take to evaluate and treat suspected carriers of the virus. Which is fine and expected for the individual arriving at the PCP office, but what I want to explore is the effects on the practice when large numbers of people begin appearing needing evaluation and treatment.
Primary Care Practices and Demand Management - How do you Detect the Upcoming Epidemic?

Photo by Levi Jones on Unsplash
From the PCP office point of view, one of the clearest signs of a heightened awareness and fear of a possible epidemic is the increase in numbers of people requiring services. However the practice is set up, the input streams (Triage calls, normal appointment calls, walk - ins, portal questions, emails among others) will begin to experience stress as volumes increase. If the practice leadership have been proactive, they may have authorized extra staff and provider hours to deal with this increase, based on the best information they have available at the time, but in effect the projected increase will be just that - a projection, or "best guess". No one knows just how big the increase over "normal" volumes will be for any given practice. Of course, this presupposes that the practice administrative staff have a good understanding of what "Normal" volume is.
In my experience with PCP offices, a normal understanding of this is a combination of data from the EHR system, usually in the form of weekly or monthly reports and typically in the form of either tables or charts. This is combined with institutional, historical knowledge, and a constant survey of the state of the outside world to arrive at the best possible understanding of the volume of demand the practice is asked to deal with on any given day. Let's go back to the data for a second. If you were to plot the volume of encounters in any given day over a period of months, you'd probably get a graph that looked something like this:
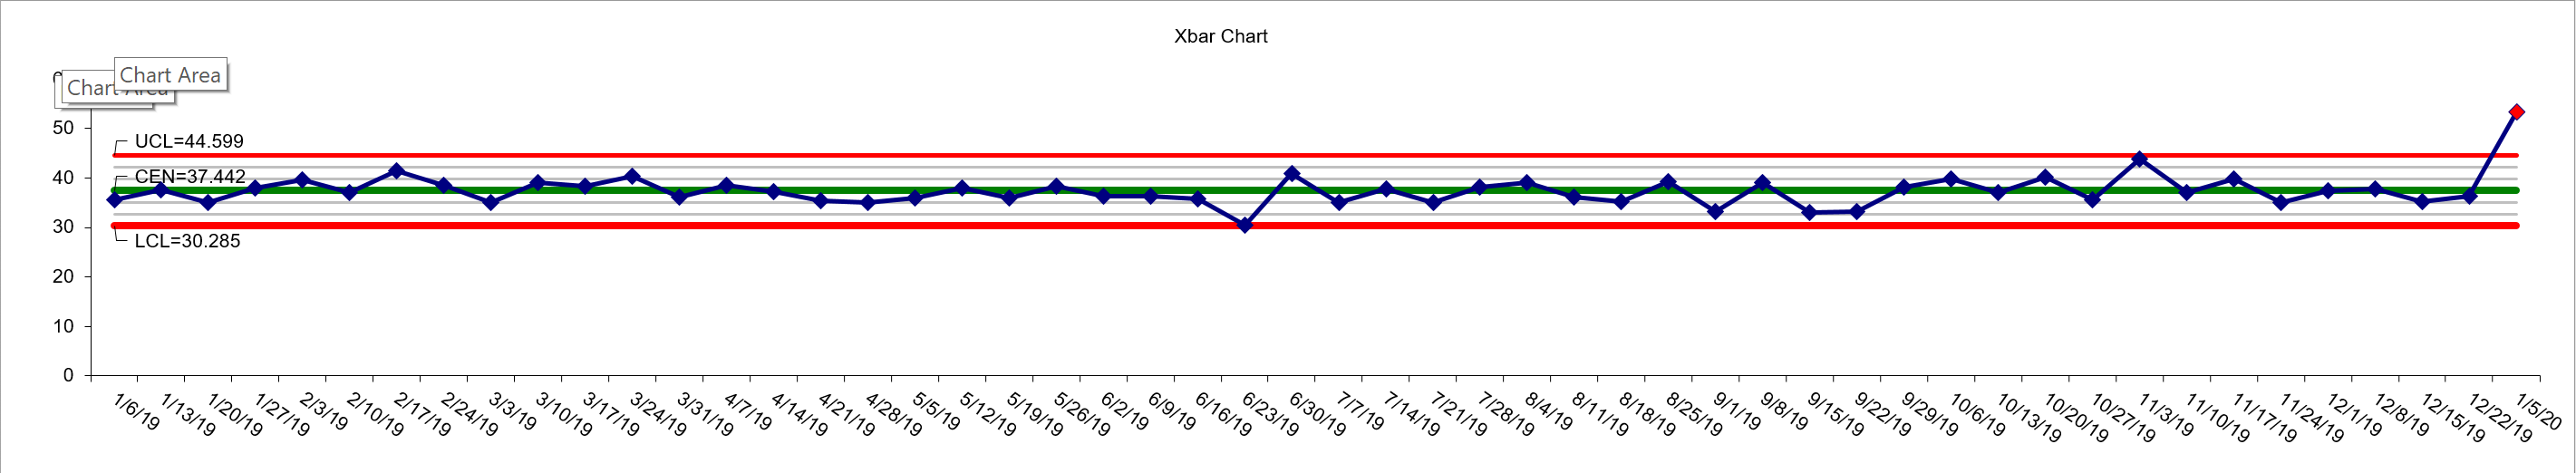
This is a fictitious practice patient encounter volume for all of 2019 and the first week of 2020. Anyone familiar with Process Behavior Charts will understand what's going on here, but for the uninitiated, this is a particular kind of graph which shows variation day to day and week to week (in this case) and calculates upper and lower control limits which show the range which each week's volume would fall given "normal" variation. In this case, the practice has to manage an average of 37 encounters per day, but may have to deal with as few as 30 or as many as 45 on any given day. That seems like a wide range, and it is if you're a small rural practice trying to serve your patients with limited resources. One main thing to notice though, is just how consistent the volume is across all of 2019. It goes up and down week to week, but never transgresses the upper and lower control limits. So long as that volume stays within those red lines, the number of patient encounters is stable and no drastic action needs to be taken. (Caveat: For those SPC experts bouncing up and down in their chairs shouting "but what about the other rules?" I've left them out for simplicity.)
Now look at week 1 of 2020. Let's say the Coronavirus outbreak hit last week in December 2019, and the nurses start to see an increase in triage calls and walk ins. They can "feel" somethings different, but can't put their finger on it. It may seem just like a few busy days, and the inevitable "it'll settle down next week" coping mechanism starts to appear. The first week in January sees a LOT more calls and walk ins, and the nurses can tell, so they start informing the providers of their concerns. Of course, by now the Providers have started feeling the increases also with the number of patients seen, but they don't necessarily see the triage activity of the nurses. Let's take a look at what happens in the next few weeks.
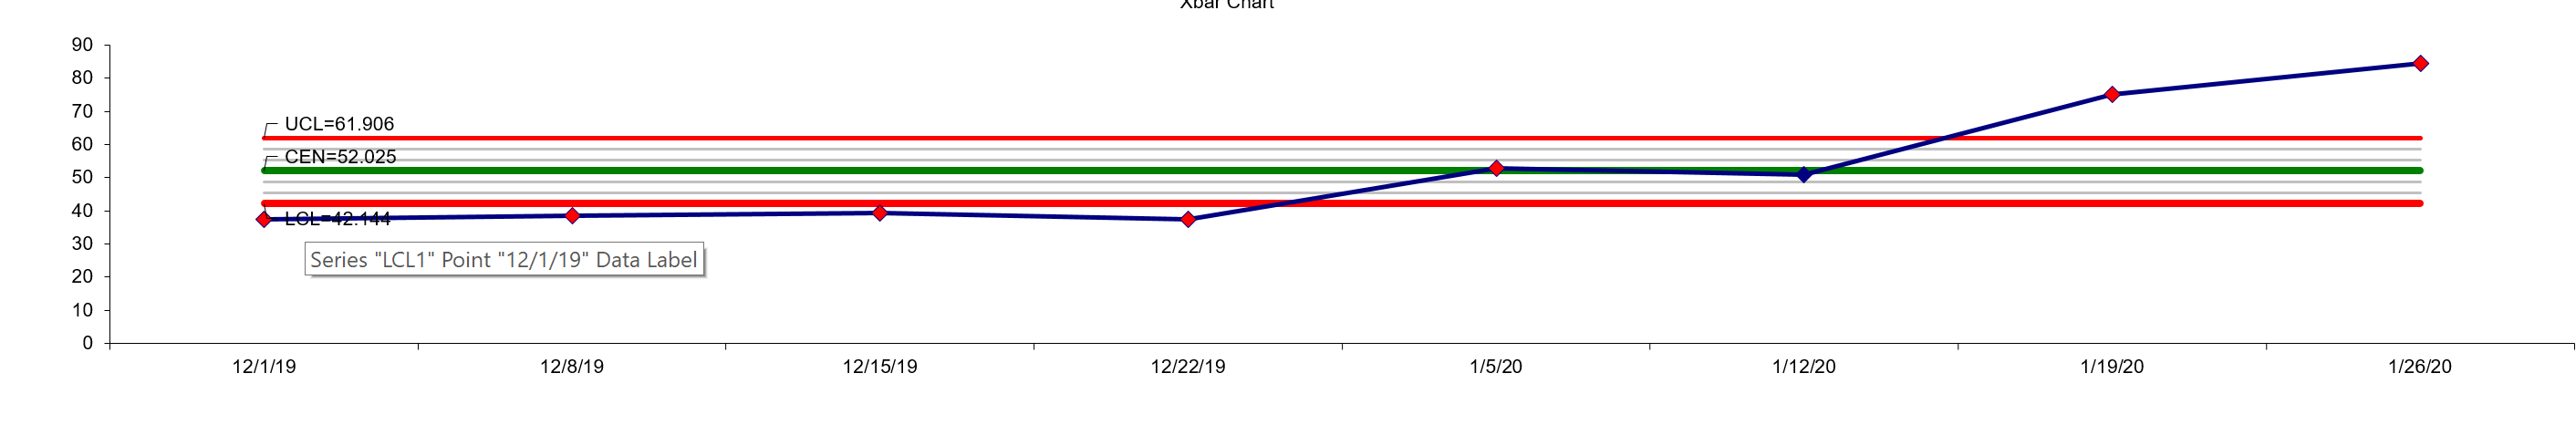
This chart represents all of December and the first two weeks of January. You'll notice the average has shifted first, from 37 to 52, and the upper limit has shifted from 45 to 62, the lower limit from 30 to 42. That's a 40% increase on average in patient encounter volume in two weeks! (The numbers are different by the way, because the graph takes into account the data for all the weeks in the chart. As the first two weeks of 2020 are higher, it shifts the averages and limits). You'll also notice that not only has the volume risen well past the upper control limit, but it's continuing to rise.
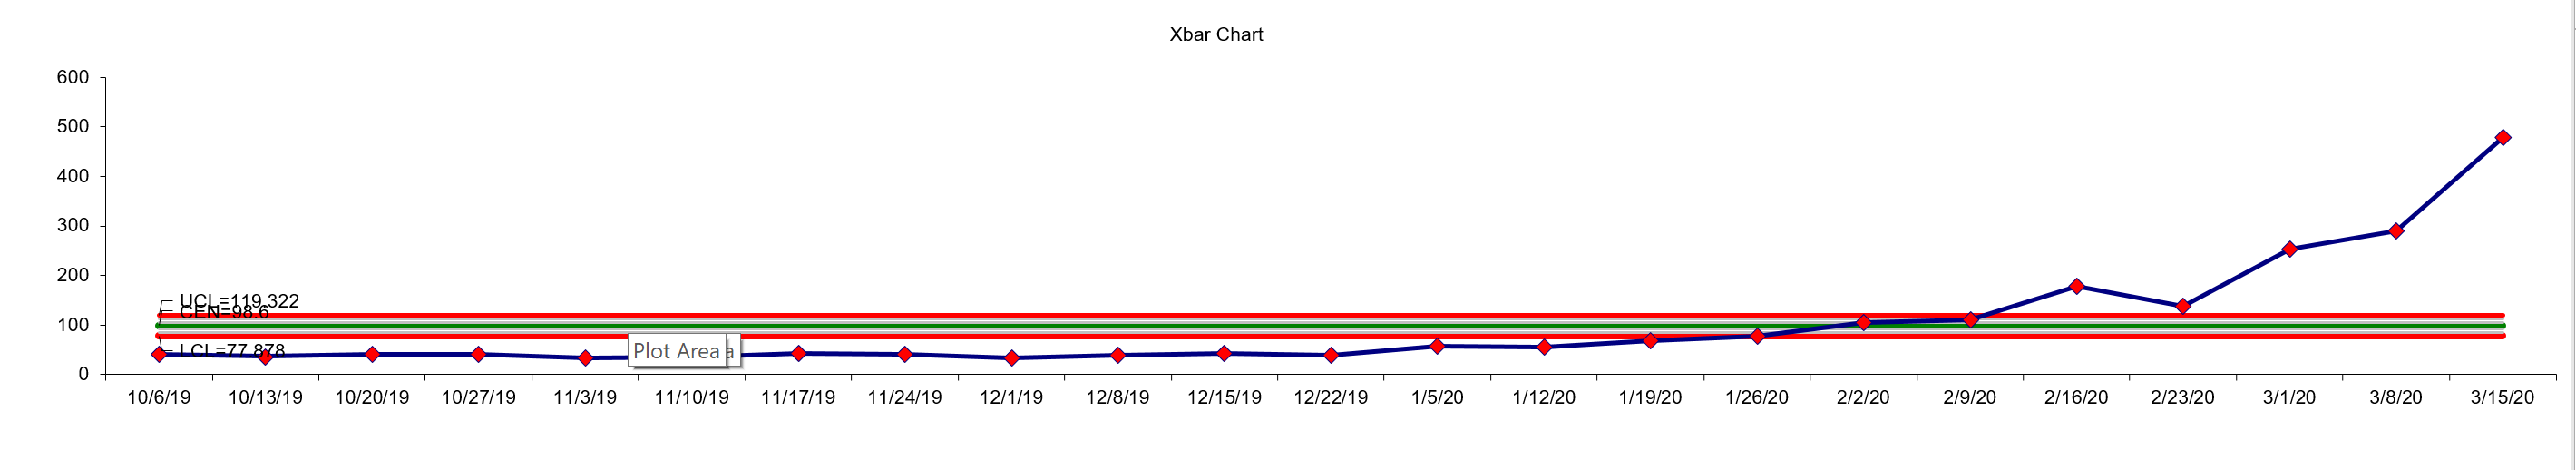
This chart represents the last 3 months of 2019 and first 3 of 2020. You can see the huge rise in volume, increasing the demands on the practice by a factor of 10 in 3 months. Without an advanced planning tool, this would likely have put so much stress on the practice, it would have been unable to cope and would get by, but leave many patients unseen as they couldn't get the help they needed. If the practice had been producing and analyzing this control chart monthly however, they would have got the first indicator at the end of week 1 2020, which would give a much better chance of designing and implementing emergency protocols to deal with the upcoming onslaught of demand.
Strategies for Dealing with Increased Demand

Photo by Sonja Langford on Unsplash
In this case, for all of 2019 the practice has balanced its resources (clinical, administrative, physical, financial) to handle the fairly consistent demand. Staff and provider schedules have been set to provide the number of hours needed to provide best quality care under this patient load.
"Every system is perfectly designed to get the results it gets" is a quote with a rich background story (told as well as anywhere by the IHI here http://www.ihi.org/communities/blogs/origin-of-every-system-is-perfectly-designed-quote) . In our practice case, the business processes upon which it runs combine to produce the results it gets. It's important to understand this doesn't just mean the success of clinical outcomes. It means everything, from the stress levels of staff and providers, to the waiting list, to the amount of stock on hand, to the schedule for staff and providers, to the wait times while in the practice for patients, to the variation between providers for conducting ostensibly the same clinical work. Everything.
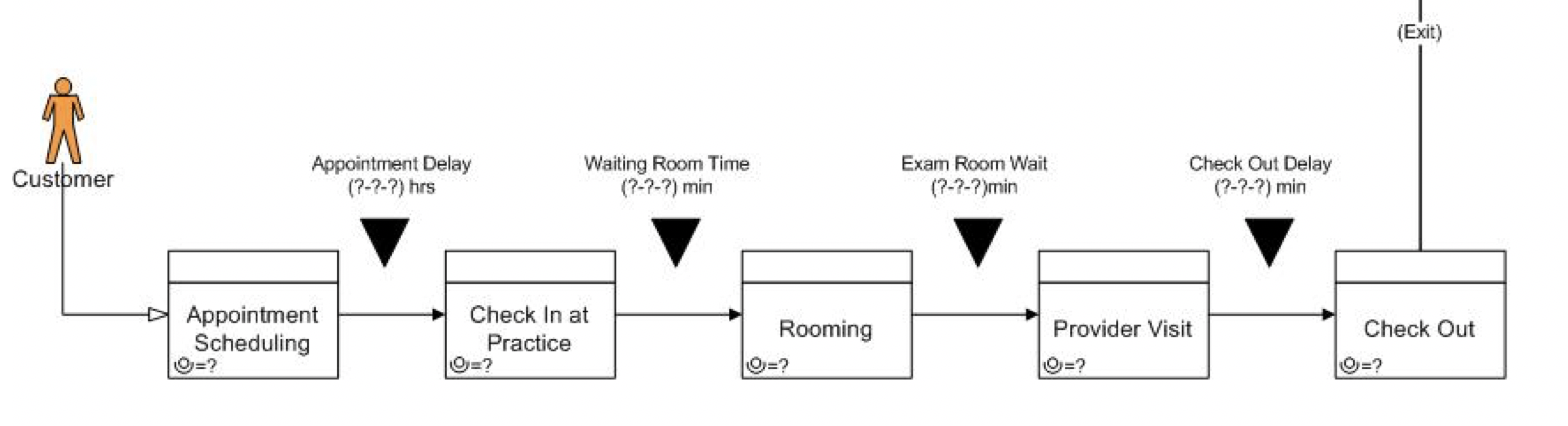
The Patient Care Value Stream
A large part of my research work over the last 25 years has been based on this concept. A practice is a complex system, comprising multiple levels and business processes. Gaining an understanding of this concept allows logical breakdown of individual components, which in turn allows analysis and improvement. A great example is the Patient Care Value Stream (PCVS). In the PCP practice, the high level process is simple.
We have worked with a lot of practices in streamlining this PCVS, usually with basic techniques to simply reduce the amount of delays between each process step. Even this can reduce patient time in the system by as much as 80%. I've also had the conversation with many excellent providers who question why that is of importance. My response is always the same:
"Firstly, it matters to your patients. If your goal is to provide truly patient centered care, then you have to see everything from the patient's point of view. Secondly, every minute that patient is in your system, they are consuming resources which cumulatively, remove them from availability for more patients, or to give more time to your staff."
It is important to stress here that I am NOT talking about cutting corners. All of this is underlined by the need and requirement to provide the best possible care. One practice we did this recently achieved a 12% reduction in resource utilization with just a few, very simple actions that cost them almost nothing. That was the equivalent of adding 1 FTE to their staff.
Present day QI in a practice setting generally doesn't consider these issues. QI in medical settings is almost always designed to produce output data to satisfy a regulatory or governing requirement, upon which some payment mechanism is based. PCMH, TCPI, CPC+, MIPS, MACRA.... All put increasing administrative loads on a practice, leaving no time to actually consider how the practice functions and provides the services it needs to.
Step by Step - First Patient Contact
How do Patients connect with your practice when they need services? For most, they contact either by phone, or by walking in.
Phone Contact
Photo by National Cancer Institute on Unsplash
Patients call, usually immediately after the practice opens and are handled in workflows specific to the practice. These can vary from paper notebooks and voicemail, to sophisticated IVR systems. Whichever system is used, the net effect is twofold. Triage and scheduling. In times of increased patient contact volume, it becomes critical to differentiate value demand from failure demand in your phone encounters. Value demand is the stuff you want (patients calling to be seen as fast as possible). Failure demand is demand created by a failure of the system to produce what is needed the first time. (Such as prescription refill questions, confusion over medication interactions, clarifying some instructions). Failure demand can run as high as 70% in some systems. Embarking on a systematic process to eliminate the root causes will release time that your patients can use to achieve their first contact, thus reducing the amount of patients needing call backs, or leaving without being scheduled, or just giving up.
Walk Ins
Photo by R O on Unsplash
Some clinics have a walk in policy where specific slots are kept open during the day so acute patients can be seen without delay. The creation and management of these scheduling devices is beyond the scope of what I wanted to explore here, but suffice to say if you have an increase in potentially highly infectious patients appearing at the practice door, there needs to be contingency plans to handle them. These can be as simple as waiting room overflows, or as sophisticated as addressing the PCVS to release previously consumed capacity so patients can be seen when they couldn't previously. Having a volume trigger point and clear emergency procedure for increased walk in volume is a tremendous help.
Step by Step - Checking In

Photo by Helena Lopes on Unsplash
The Check in process can be as simple as a 10 second verification of identity and insurance changes, or a multi minute endeavor with a new patient. How many of each does the practice get on any given day? Studying volumes at check in can reveal similar insights as the overall PCVS analysis. Drilling down, how many Patients turn up with every piece of information they need to check in successfully? How can you increase that number systematically? Some solutions have involved better signage, marketing campaigns aligned with population health initiatives and better visual indicators of state in the waiting room.
Step by Step - The Waiting Room

Photo by Benyamin Bohlouli on Unsplash
Once a Patient arrives, can they be seen immediately? Often the answer is no, so what can be done in a waiting room to reduce the time between the end of the Check in process and the point of retrieval by the Nurse or MA to commence the rooming process? Most waiting rooms have no systems to manage the patient dwell time. I've seen success with producing and managing a big visual board indicating wait times and individual patient times, as well as sophisticated electronic systems encompassing whole hospital flow such as the latest GE "command centers" being deployed worldwide now. The concept is the same. Think "How can I make sure that this patient is in the system, and that the nurse / MA is aware of their presence immediately they sit down?" Some practitioners have developed Patient Kanban systems, which have been adopted and had great success. Whichever systems work in your environment, it's important to start thinking of them as the beginning of an integrated patient flow management system, with the goal of reducing delays between steps as much as possible.
Step by Step - Rooming

Photo by CDC on Unsplash
Rooming commences when the Nurse / MA retirees the Patient from the waiting room and taken to the exam room. One major cause of delay here is the availability of a free exam room. Many times patients are delayed in the waiting room because an exam room is not ready for occupation, and many of those times are because there is no way of knowing if a closed door on an exam room means there is a patient inside or not. Simple visual indication systems such as multi colored flag systems can help, as well as EHR based systems of flagging for downstream staff to understand if rooms are ready and available.
Another delay in rooming can occur when the room turnaround time is significant. Drilling down to root causes of those can reveal such issues as non standard cleaning routine and stock outs of essential supplies and materials.
Step by Step - The Patient Exam

Photo by National Cancer Institute on Unsplash
Every provider develops a personal style for what on the surface seem like standard interactions with the patient. Some get right down to business, some talk a lot to get the background and then work their way to the presenting issue. This variation between providers can be significant, and can eat into system capacity. The first step to understanding this issue is to measure it. I often don't get to the depths of the patient exam routine, as this typically represents a higher level of interaction with a practice that requires a solid base of work and success to be in place. Done correctly though, it can be a source of significant time reclamation.
Step by Step - Check Out

Photo by Martha Dominguez de Gouveia on Unsplash
The Check Out process can be as simple as a verbal acknowledgment as the patient leaves, or as complex as setting up follow up appointments, medication reconciliation and associated details. I typically look for recurring instances of delays presenting at the check out station, delays while in the process of check out and delays leaving the building. If there's a queue at check out - it is a fairly obvious indicator that something is not functioning correctly. Aligning with Deming for a second - you'll most often find that the causes of those delays are systemic, not people based. They'll things like missing discharge orders, missing prescription details (so having to go back to the provider to verify) and such items.
Conclusions
Ive tried to give enough examples of simple, concrete actions a practice can take to release capacity and prepare for a sudden increase in patient encounter volume (such as a Corona Virus outbreak). These last few items have all addressed system capacity, and are not meant to be a comprehensive list, just a few pointers to get started. If you are interested in exploring what this could look like in detail for your practice, hospital or health system, please head over to my website at https://bryanresearch.com and learn more. You can also contact me at This email address is being protected from spambots. You need JavaScript enabled to view it.